Featured image by LA guide, Nick Estrada
The best online tools for tracking, monitoring, and managing risks of the 2020 California fire season.
2020 is proving to be full of surprises, not the least of which we’re currently facing: the most devastating fire season in California history. With more than 20 major fires currently ablaze across the state, 2020’s record-setting California wildfire season has so far resulted in more than 3.6 million acres scorched, an area larger than Connecticut and roughly 3.6% of the state’s total land mass.
With the increase in fire threat comes an increase in information, and often misinformation, surrounding the current status of California’s fires.
Live fire updates, fire satellite trackers, fire location maps, air quality index monitors, and evacuation alerts are the critical resources people seek. Where are the fires burning? What is the air quality in my area? Will my backpacking trip with Lasting Adventures be affected? These are the valid questions people are asking.
As Yosemite’s largest backpacking guide service, managing risk around wildfires comes down to accurate updates, monitoring resources, and forecasts. To ensure that we make the most informed decisions possible, we rely on precise information provided by both our guides in the field as well as by a variety of online tools that help us monitor fire status and smoke/air quality.
Here are our top choices for wildfire monitoring resources in the 2020 fire season.
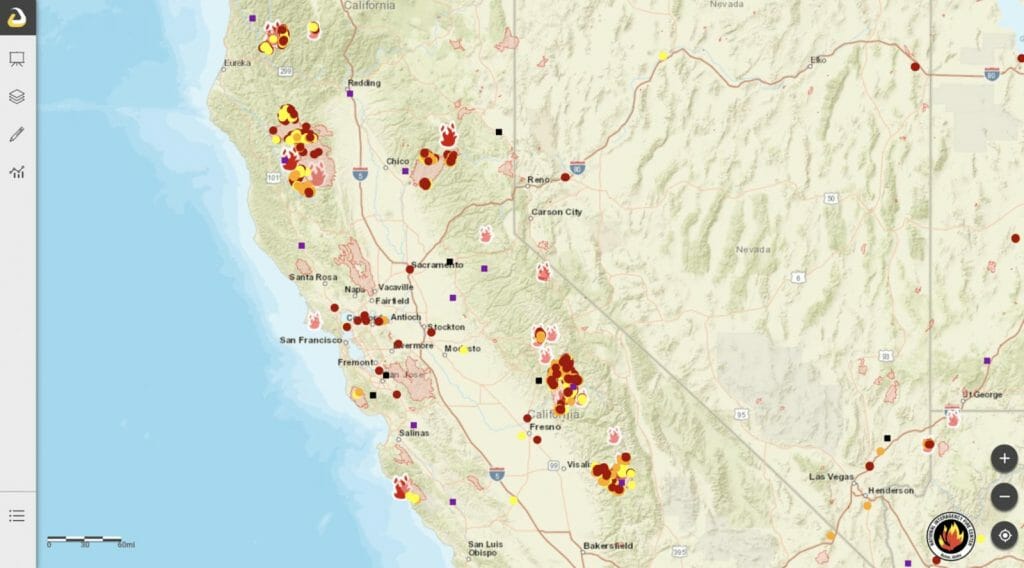
The National Fire Situational Awareness map allows viewers to monitor current fire conditions via an easily digestible, highly accurate graphic.
Satellite Fire Mapping
National Fire Situational Awareness
Zoom in on any portion of the National Map for an intricately detailed map that monitors fire progress. Fire progress is indicated by color scheme with clear and easy legend; Red= new fire in past 12 hours, Orange = past 12-24 hours, and Yellow= past 24-28 hours.
Pros: This system clearly lets us see the firefighters’ progress with back-burns and fire lines, for example with the 2018 Ferguson Fire when they stopped the fire from reaching our guide house with a barrier around the northwest corner of the fire.
Cons: The map is only updated about once every 6 hours.
Zoom.Earth
Zoom.earth shows a live* satellite view of the planet, as well as history. Not only is it a great resource to see how the smoke is drifting, it’s fun to cycle back through older images and watch the smoke and clouds shift. *Images are delayed by about 20 minutes.
Pros: Fairly high-quality satellite imagery. Years of historical satellite imagery.
Cons: Nothing major!
Smoke and Air-Quality Monitors
PurpleAir.gov
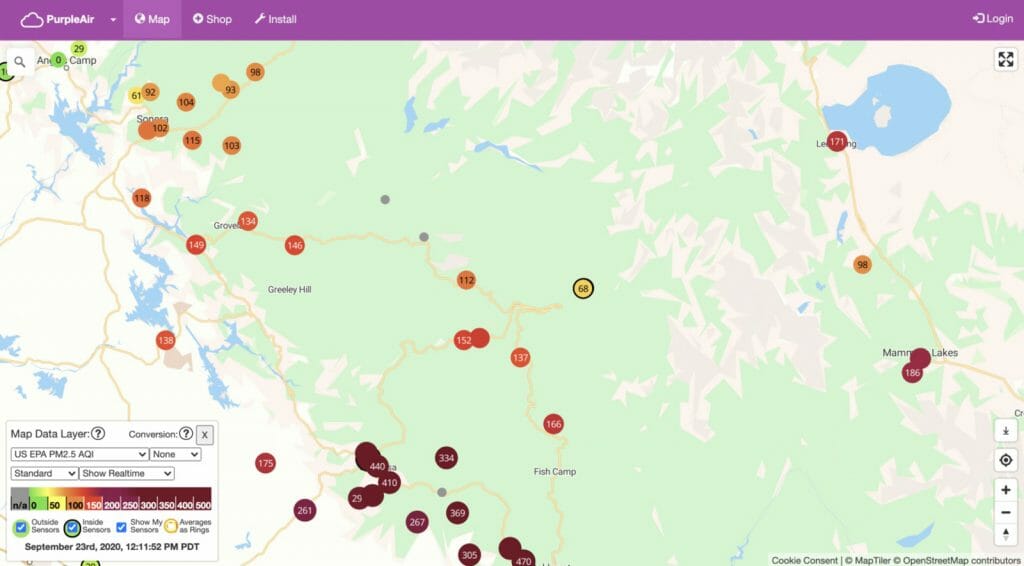
Our preferred air-quality monitoring system, Purple Air provides real-time updates on current fire conditions based on information obtained from various weather stations across the US.
Pros: Offers instantaneous air-quality levels, or it can show averaged values over a few different time frames within the last week.
Cons: The air quality index numbers differ significantly from the AirNow (government) sensors. This can be corrected by clicking on the ‘None’ box under ‘Conversion’ in the lower left, and switching it to ‘LRAPA’.
AirNow.gov
Provides updates on current air conditions using PM 2.5 and ozone mapping based on weather station data across the US.
Pros: Available in a sleek and easy-to-read phone app, as well as on desktop via the internet.
Cons: Only monitors based on ozone mapping in some areas, which does not accurately encompass the total air quality. Only updates every few hours.
Pro tip: Check both to deduce the most accurate estimate of current smoke and air quality conditions.
Weather and Wind Reports
Weather: Weather.gov
In our experience, this is the most reliable weather reporting and forecasting site available. It is where many other weather reporting sites get their information from. Weather.gov puts out hazardous weather statements; if you see a Red Flag Warning, that’s an indication of extreme weather which will make fires worse.
Pros: Highly customizable weather forecasts; just pull up the map and click onthe area you want a forecast for, and weather.gov will give you a forecast down to your square mile, give or take. No clickbait as on many other weather service sites.
Cons: The interface is a bit dated, and as far as Cons go—it’s a pretty mild one.
Wind: Windy.com
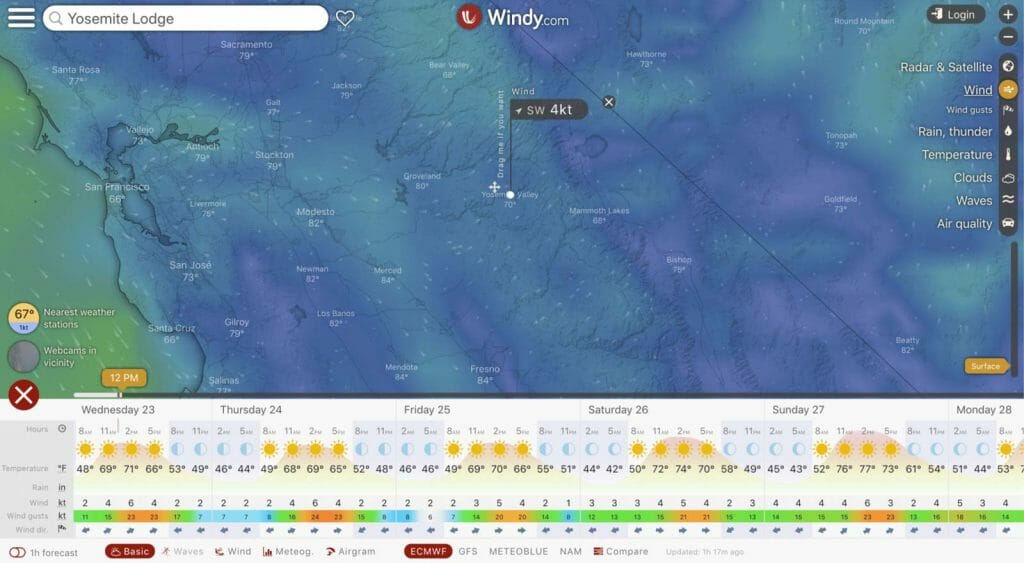
Infographics that draw data from the U.S. National Oceanic and Atmospheric Administration, Meteoblue AG at Switzerland’s University of Basel, and the Copernicus Atmospheric Monitoring Service, a nonprofit that offers feeds from European satellites.
Pros: Information is available on Windy’s website and app, both of which use compression and transmission systems to load complex graphics quickly, even in locations of poor reception. Windy also features direct links to live webcams in the area you search for!
Cons: Nothing major.
Fire Reports
CALFIRE Incidents
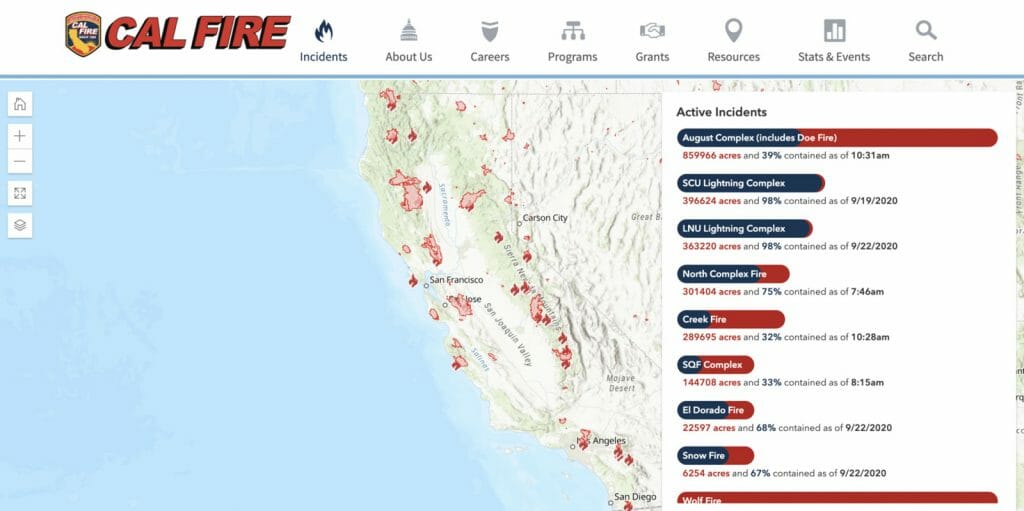
CalFire provides a page dedicated to each fire which is updated 2 to 3 times per day.
Pros: Shows all incidents across the state, as well as visual indications on how close the fires are to containment.
Cons: Sometimes information is a little slower to appear on the CalFire page if CalFire isn’t in command of the fire.
INCIWEB
Incident Information System
Pros: Generally provides the most up-to-date information before any other source.
Cons: Until a fire is under a national team, InciWeb doesn’t provide information on CalFire incidents.
Real-Time Webcams
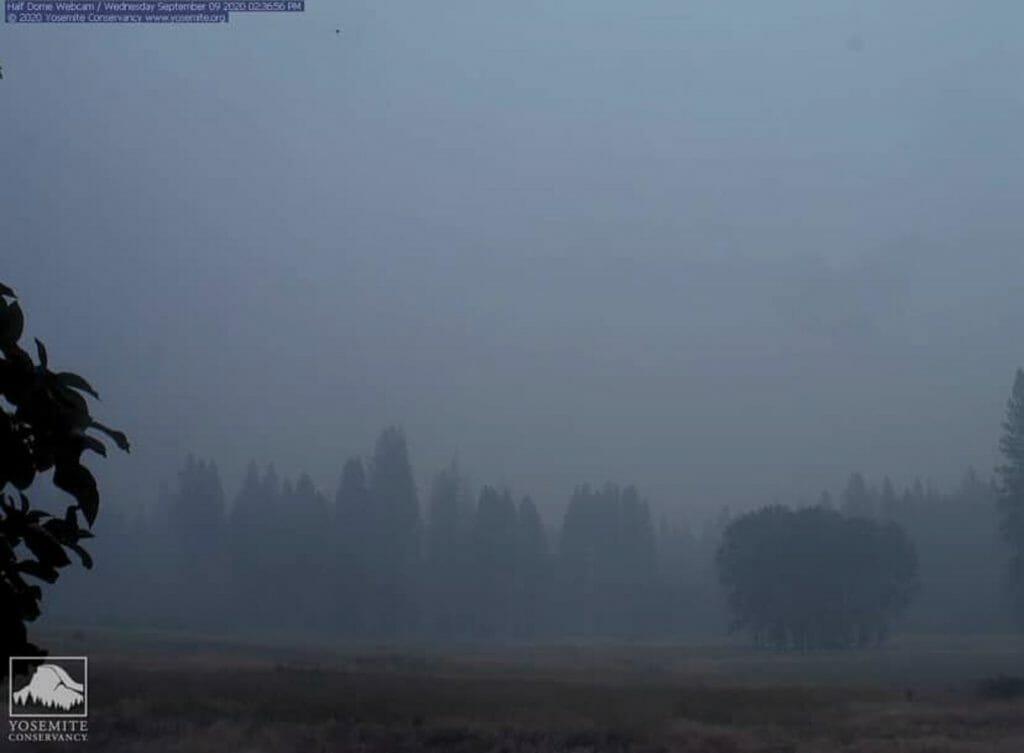
Yosemite Valley Live Webcams
To help visitors monitor fire and smoke conditions in real time, Yosemite National Park offers live webcams with various views of the Yosemite Valley. These can give you a first-hand sense of the conditions on the ground in the park.
Pros: Real-time video footage of Yosemite Falls, Half Dome and more.
Cons: Camera quality is not the best. The images captured by the cameras tend to ‘compress’ the smoke, making it look worse than it actually is. If you can’t see anything, then it’s very smokey, but if you can make out features on the granite walls, it’s typically not actually too smokey.
Evacuation Alerts
Everbridge Alerts
If you’re a citizen of Tuolumne County, Mariposa County, or Yosemite, it pays to sign up for emergency alerts through Everbridge. In fact, we recommend that you sign up for emergency alerts in your home county; try searching for ‘your county name’ and either ‘emergency alert system’, ‘Everbridge’, or ‘CodeRed’.
Here are links to our local counties, if you’re a resident:
There really are no cons to signing up for an emergency alert service. It may save your life.
View this post on Instagram
Following Instagram pages like @yosemitenps or other parks’ are a great way to get timely visual updates.
Social Media
Facebook and Instagram pages specific to Federal Forest, National Park, County and/or Sheriff offices involved in firefighting efforts. For example, around Yosemite: Yosemite National Park, Mariposa County Sheriff , Tuolumne County Sheriff , Madera County Sheriff, and even the Yosemite Fire and Aviation Page. Sheriff Office’s usually post the same Daily Status Updates that can be found on CALFIRE and INCIWEB above.
Another useful resource is private Facebook groups that focus on providing area-specific incident reporting such as Tuolumne County Incident Feed, Mariposa County Incident Feed and Madera County Wildfire Incidents. Most of these groups require approval to be a member. (Most group admins like to keep their groups private to locals only.) Group Members then post to these pages when they hear or witness something that may be a threat to those in their county. Follow-up comments provide more context and real-time information on what is going on. Sometimes when a fire or incident begins- this can be the best source of information.
MORE
For real-time updates on Yosemite closures and conditions, visit the Yosemite’s Current Conditions page.
For more updates on Yosemite and Lasting Adventures operations, follow us on Instagram.

